44
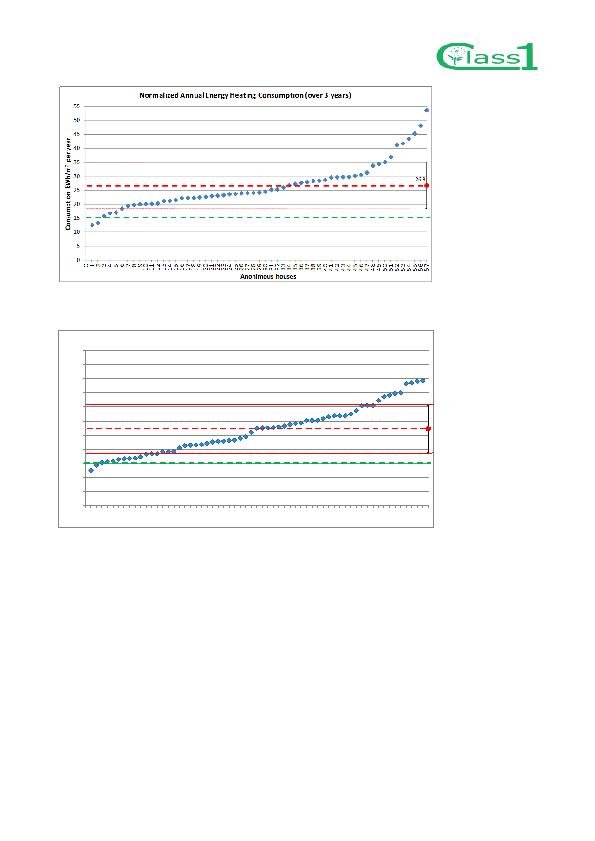
Figure 49. Monitored data of annual net space heating in the flats (3 years data). Green = Design requirement: 15 kWh/m² year,
Red = Average demand of the apartments, 26.8 kWh/m² year.
Figure 50. Monitored data of annual net space heating in the flats (1 year data). Red = Average demand of the apartments, 27.3
kWh/m² year.
Considering a more consistent number of flats (Figure 50), with data of the last year of monitoring, the
overall performance doesn't change: the average demand is only slightly higher (27.3 15 kWh/m²/year).
In Figure 51 the frequency of the normalized annual space heating data is presented. Considering 3 years
data, a concentration of flats with demand in the 25 kWh/m²/year consumption class can be observed.
Considering 1 year data the demanding peak is in a lower (and more performing) consumption class (20
kWh/m²/year), but the peak is smoother and higher consumption classes are more numerous.
27.3
0
5
10
15
20
25
30
35
40
45
50
55
0 1 2 3 4 5 6 7 8 9
10
11 12 13 14 15 16 17 18 19 20 21 22 23 24 25 26 27 28 29 30 31 32 33 34 35 36 37 38 39 40 41 42 43 44 45 46 47 48 49 50 51 52 53 54 55 56 57 58 59 60 61 62
C
o
n
s
u
m
p
t
i
o
n
k
Wh
/m
2
p
e
r
ye
a
r
Anonimous houses
Normalized Annual Energy Heating Consumption (last year)