52
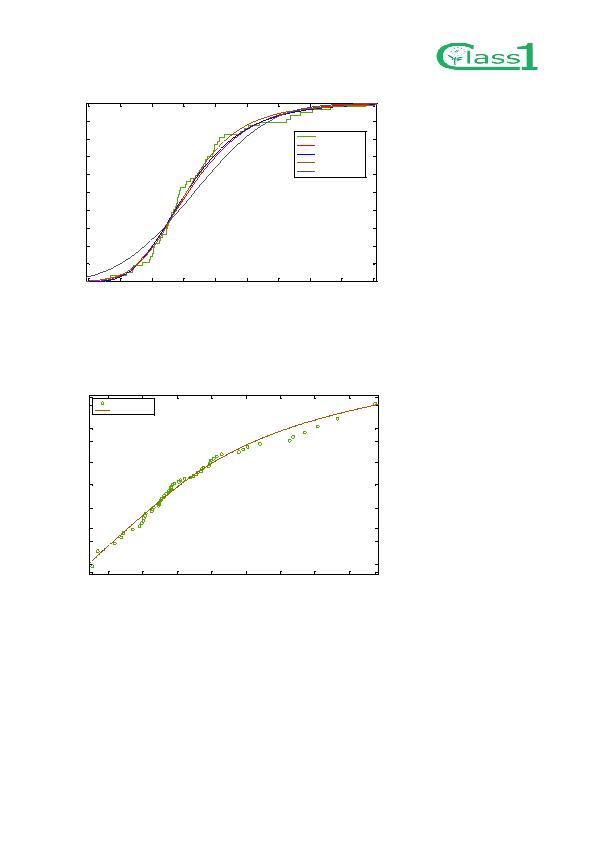
Figure 63. Annual normalized space heating (3 years data): cumulative probability of the monitored data and of the possible
probability distributions.
Figure 64 shows the probability plot of the monitored data and of the identified Log.Logistic probability
distribution fitting the measured data.
Figure 64. Probability plot of the monitored data of annual normalized space heating (3 years data) and of the best fitting
probability distribution.
The simulations were performed considering the following base configuration:
Indoor temperature: 20°C;
Internal heat gain for equipment: 3.5 W/m
2
Internal heat gain for persons: 1.5 W/m
2
Resulting in a total internal heat gain of 5 W/m
2
For the sensitivity analysis, the total internal heat gain varied from 2.5 to 8.5 W/m
2
and the indoor
temperature varied from 19 to 23 °C.
10
15
20
25
30
35
40
45
50
55
0
0.1
0.2
0.3
0.4
0.5
0.6
0.7
0.8
0.9
1
Normalized Heating Consumption [kWh/m2/y]
Normalized Heating over 3 years
Cumulative probability
C
u
m
u
l
a
t
i
ve
p
r
o
b
a
b
i
l
i
t
y
Hm23yData data
Birnbaum-S
Gener-EV
Log-Logistic
Weibull
15
20
25
30
35
40
45
50
0.005
0.01
0.05
0.1
0.25
0.5
0.75
0.9
0.95
0.99
0.995
Normalized Heating Consumption [kWh/m2/y]
Normalized Heating over 3 years
Probability
P
r
o
b
a
b
i
l
i
t
y
Hm23yData data
Log-Logistic