54
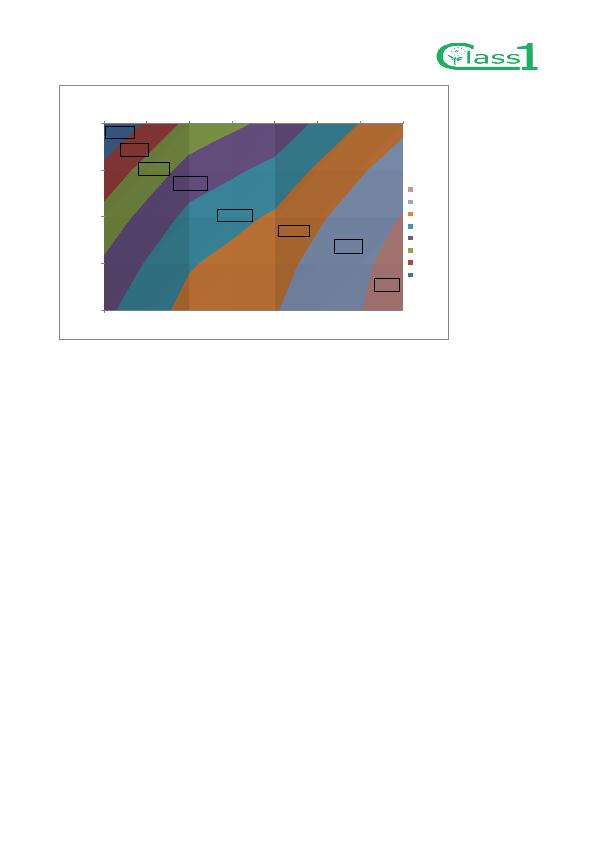
Figure 67. Normalized space heating consumption probability related to possible variations of internal heat gains and indoor
temperature.
The overall result is that this statistical analysis shows good correlation with the observed variations in net
heating energy consumption of the apartments and therefore this can be said to be as expected.
19.0
20.0
21.0
22.0
23.0
2.50
3.50
4.50
5.00
5.50
6.50
7.50
8.50
I
n
d
o
o
r
T
e
m
p
e
r
a
t
u
r
e
[
°
C]
Normalized Heating. 3 Years data
Normalized Energy Consumption probability distribution in relation with
Indoor temperature and internal heat gains
5.0-10.0
10.0-15.0
15.0-20.0
20.0-25.0
25.0-30.0
30.0-35.0
35.0-40.0
40.0-45.0
Internal Heat Gains [W/m
2
]
29.20
%
0.32
%
3.43
%
14.96
%
26.06%
14.15%
6.39%
2.85%