48
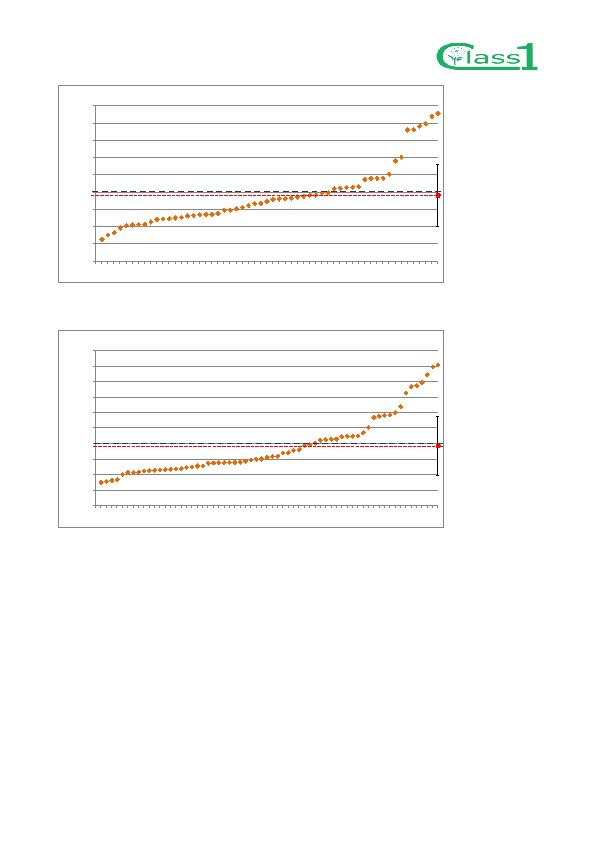
Figure 57. Calculated annual consumption of lighting and electrical devices in the flats (3 years data). Blue = normal annual
electricity demand in DK app. 2000 kWh/y, Red = Average demand of the 56 flats app. 1906 kWh/y.
Figure 58. Calculated annual consumption of lighting and electrical devices in the flats (last year data). Blue = normal annual
electricity demand in DK app. 2000 kWh/y, Red = Average demand of the 64 flats app. 1933 kWh/y.
The differences between 3 years and 1 year data frequency distribution can be seen in Figure 59: with a
higher number of flats (1 year data) there is an increase in the frequency peak consumption class (1500
kWh/y) which is common to both datasets. This, together with the decrease of the 2000 kWh/y class should
lead to a lower average value, but this positive effect is balanced by the increase of the 3000 kWh/y class.
1906
0
500
1000
1500
2000
2500
3000
3500
4000
4500
0 1
2 3 4 5 6 7 8 9
10 11 12 13 14 15 16 17 18 19 20 21 22 23 24 25 26 27 28 29 30 31 32 33 34 35 36 37 38 39 40 41 42 43 44 45 46 47 48 49 50 51 52 53 54 55 56
C
o
n
s
u
mp
t
i
o
n
[
k
Wh
/y]
Anonimous houses
Lighting & El. Equipment Consumption (3 years data)
1933
0
500
1000
1500
2000
2500
3000
3500
4000
4500
5000
0 1 2 3 4 5 6 7 8 9
10
11 12 13 14 15 16 17 18 19 20 21 22 23 24 25 26 27 28 29 30 31 32 33 34 35 36 37 38 39 40 41 42 43 44 45 46 47 48 49 50 51 52 53 54 55 56 57 58 59 60 61 62 63 64
C
o
n
s
u
m
p
t
i
o
n
[
k
Wh
/y]
Anonimous houses
Lighting & El. Equipment Consumption (last year data)