51
Combining the identified probability distribution of data and the results of the sensibility analysis by means
of simulations, each couple of internal heat gains-indoor temperature values can be associated to a
probability value.
6.2.2. Sensibility and Statistical analysis results
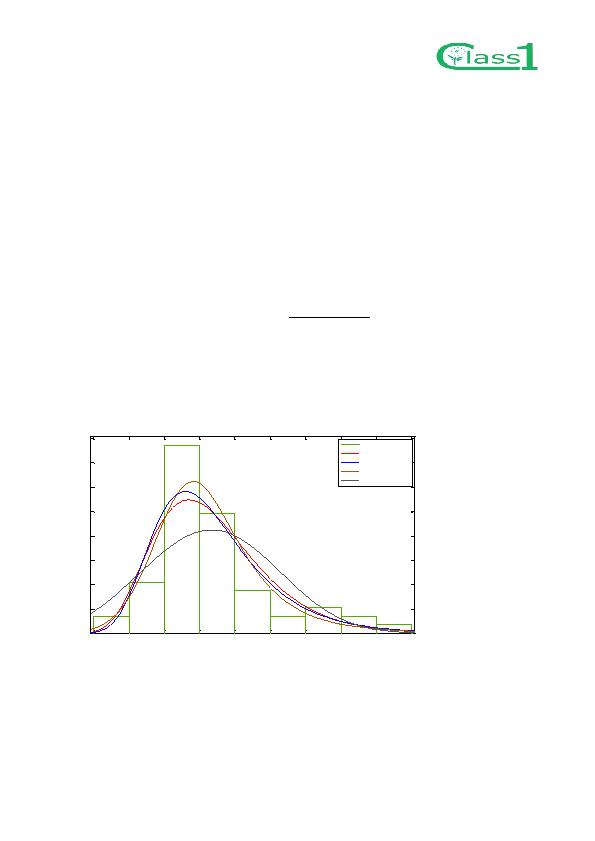
Four different possible probability distributions have been considered:
Birnbaum-Saunders
Generalized extreme value
Log-Logistic
Weibull
Considering both the density plot and the cumulative probability plot (Figure 62 and Figure 63), the best
fitting probability distribution is the Log-Logistic, whose general function is:
( )
(
/ )(
/ )
[ (
/ )
]
( )
/
The estimated best fitting parameters for the distributions are:
µ: 3.21775 (Std. Err. : 0.0373792) and : 0.166303 (Std. Err. : 0.0189165) with a mean value of 26.1451
and a variance of 69.83.
Figure 62. Monitored data of annual normalized space heating (3 years data): density histogram and possible probability
distributions.
10
15
20
25
30
35
40
45
50
55
0
0.01
0.02
0.03
0.04
0.05
0.06
0.07
0.08
Heating Consumption [kWh/m2/y]
D
e
n
si
t
y
Normalized Heating
Histogram and possible probability distributions
Hm23yData data
Birnbaum-S
Gener-EV
Log-Logistic
Weibull