establish the energy consumption as it would have been in case no energy savings had been implemented.
For the new buildings, this has been calculated based on the assumptions that without the special Class1
requirements they would have been built according to the requirements in the Danish Building regulations.
For the existing buildings reliable monitored data did not exist and the "before" energy consumption is
based on the "Energy labelling" scheme in Denmark the Danish implementation of the EU Building
Perfornance Directive. There was no RES contribution in this scenario. The summary result is presented in
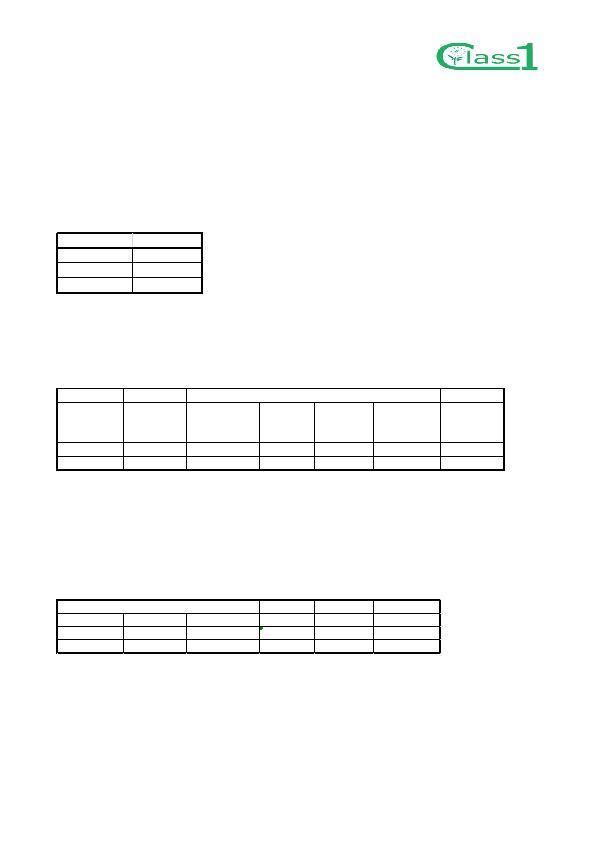
Table 12.
Table 13 and Fejl! Henvisningskilde ikke fundet.. Table 13 shows the overall demand of heating and
electricity and how this demand is covered by the RES -PV, solar thermal systems, heat pumps and bio-
fuelled heating.
Municipality of Egedal. The column Conv. Energy shows the amount of conventional energy has to be used
respectively for heating and electricity.
In Table 14 the resulting primary energy consumption is shown and compared to the situation where the
new buildings were constructed in a conventional way and the existing buildings not renovated. The
electricity consumption has been multiplied by a factor 2,5 as it is defined/required in the energy
requirements in the Danish building regulations to reach the corresponding primary energy.
69% both for heating and electricity.