app. 46.9 kWh/m
of a different analysis approach in order to understand the possible reasons of non-uniformities and to find
possible numerical models describing the relations between boundary conditions and measured
consumption data.
Two different advanced analysis methods have been adopted: the first is based on the combination of a
statistical description of consumption data and a sensibility analysis performed by mean of simulations.
The latter aims to identify those variables (among boundary conditions and measured consumption data)
with high correlation values, and to find a numerical model able to return a consumption value starting
from known boundary conditions.
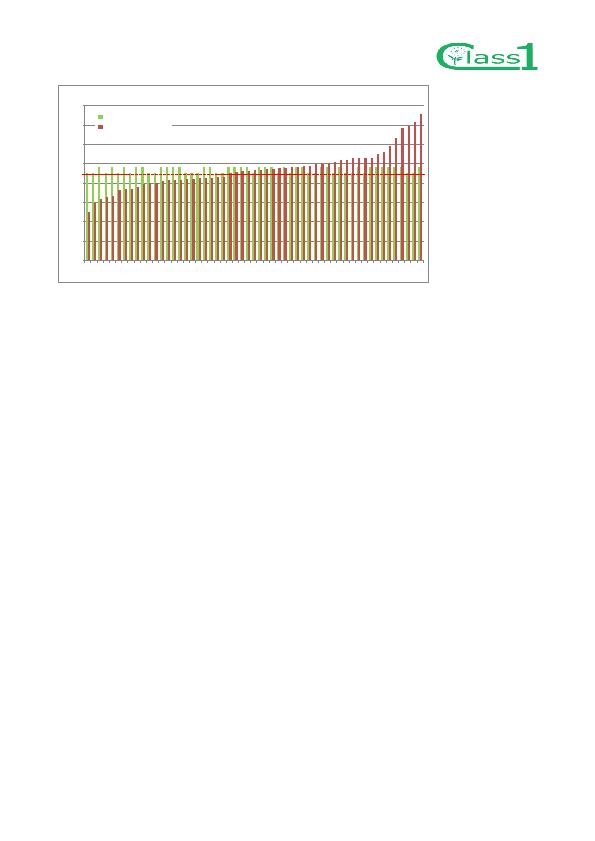
analysis of the measured data. The quantity object of the analysis is the normalized annual space heating
consumption. A dataset of the annual normalized space heating consumption calculated over 3 years data
for 57 flats is used.
Different possible probability distributions are considered, density plot and cumulative probability plot are
used to identify the best fitting probability. Once the probability distribution which best fits the monitored
data has been found, it is possible to calculate the probability of a single normalized space heating
consumption value and the probability of a range of normalized space heating consumption values.
By means of simulations the space heating consumption is calculated by varying internal heat gains and
indoor temperature: each couple of internal heat gains-indoor temperature values can be associate to a
normalized space heating consumption value.
u
i
o
kWh
y
e
r