background image

46
Figure 53. Monitored data of annual DHW demands in the flats (last year data). Red = Average demand of the apartments, 10.7
kWh/mē year.
The analysis of the consumption frequency (Figure 54) confirms a stable trend in the distribution of data: in
both data sets: the 10 kWh/mē/year consumption class is the most significant (between 35% and 40% of
the flats are in this class), followed by the 15 kWh/mē/year.
Figure 54, Frequency of the monitored data of DHW demands: 3 years data and last year data

Electric Energy Demands
The monitored value of total electricity consumption consists of energy for ventilation, for lighting and for
electrical devices. A standard energy consumption of the ventilation system was calculated as described
above in METHODS and resulted in an annual consumption of 735-835 kWh/h depending on the size of the
apartments.
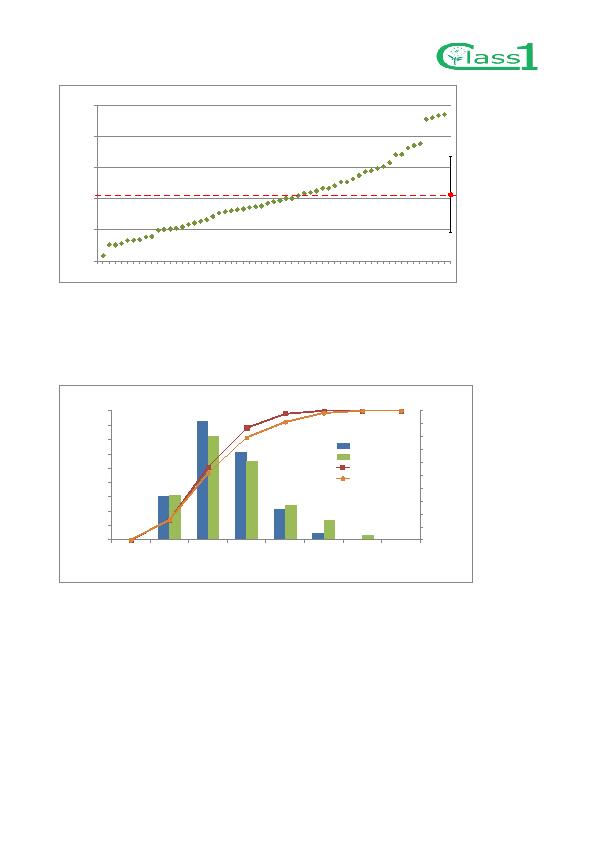
An overview of the total electric energy consumption for the 56 flats with 3 years data is shown in Figure
55.
The consumption varies between about 1000 kWh/y and 4500 kWh/y, with an average value of about
2200 kWh/y.
Figure 56 shows that the frequency peak consumption class remains 2000 kWh/y both considering 3 years
and 1 year data, but considering the dataset with a higher number of flats (last year data) the second
10.7
0
5
10
15
20
25
0 1
2 3 4 5 6 7 8 9
10 11 12 13 14 15 16 17 18 19 20 21 22 23 24 25 26 27 28 29 30 31 32 33 34 35 36 37 38 39 40 41 42 43 44 45 46 47 48 49 50 51 52 53 54 55 56 57 58
C
o
n
s
u
mp
t
i
o
n

[
k
Wh
/y]
Anonimous houses
DHW Consumption (last year data)
0%
10%
20%
30%
40%
50%
60%
70%
80%
90%
100%
0%
5%
10%
15%
20%
25%
30%
35%
40%
45%
0
5
10
15
20
25
30
More
C
u
m
.

F
r
e
q
.
F
r
e
q
u
e
n
c
y
Consumption Class
[kWh/m2/year]
DHW Consumption frequency
% 3 years
% last year
Cum.% 3 years
Cum.% last year