47
frequency consumption class shifts from 2500 to 1500 kWh/y; this have repercussions on the average
demand of the apartments too, which shifts to about 1900 kWh/y.
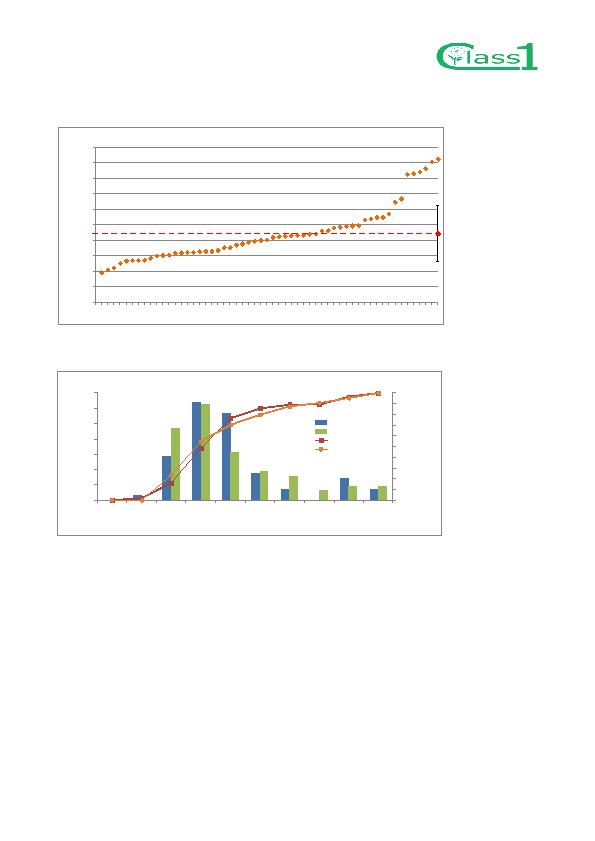
Figure 55. Monitored data of annual total electricity demands in the flats (3 years data). Red = Average demand of the
apartments, 2219 kWh/year.
Figure 56. Frequency of the monitored data of total electricity demands: 3 years data and last year data
Subtracting the estimated electric energy for ventilation to the total electricity consumption, the
consumption for lighting and electrical devices is calculated. Statistically the annual consumption for
lighting and electric devices in Denmark is approximately 2000 kWh.
In Figure 57 and Figure 58 an overview of the consumption for lighting and electric devices is presented.
The plots for 3 years data and 1 year data are very similar: in both cases the minimum value is around 500
kWh/y, the maximum around 4500 kWh/y and the average value is around 1900 kWh/y. In both the
datasets the average value is lower than the normal annual consumption in DK for flats.
2219
0
500
1000
1500
2000
2500
3000
3500
4000
4500
5000
0 1
2 3 4 5 6 7 8 9
10 11 12 13 14 15 16 17 18 19 20 21 22 23 24 25 26 27 28 29 30 31 32 33 34 35 36 37 38 39 40 41 42 43 44 45 46 47 48 49 50 51 52 53 54 55 56
C
o
n
s
u
mp
t
i
o
n
[
kWh
/y
]
Anonimous houses
Total Electricity Consumption (3 years data)
0%
10%
20%
30%
40%
50%
60%
70%
80%
90%
100%
0%
5%
10%
15%
20%
25%
30%
35%
500
1000
1500
2000
2500
3000
3500
4000
4500
More
C
u
m
.
F
r
e
q
.
F
r
e
q
u
e
n
c
y
Consumption Class
[kWh/year]
Total Electricity Consumption frequency
% 3 years
% last year
Cum.% 3 years
Cum.% last year